Schlagwort: Climate Change

  • Sentinel-1 documents largest ice loss at Petermann Glacier since 2012

    Sentinel-1 documents largest ice loss at Petermann Glacier since 2012

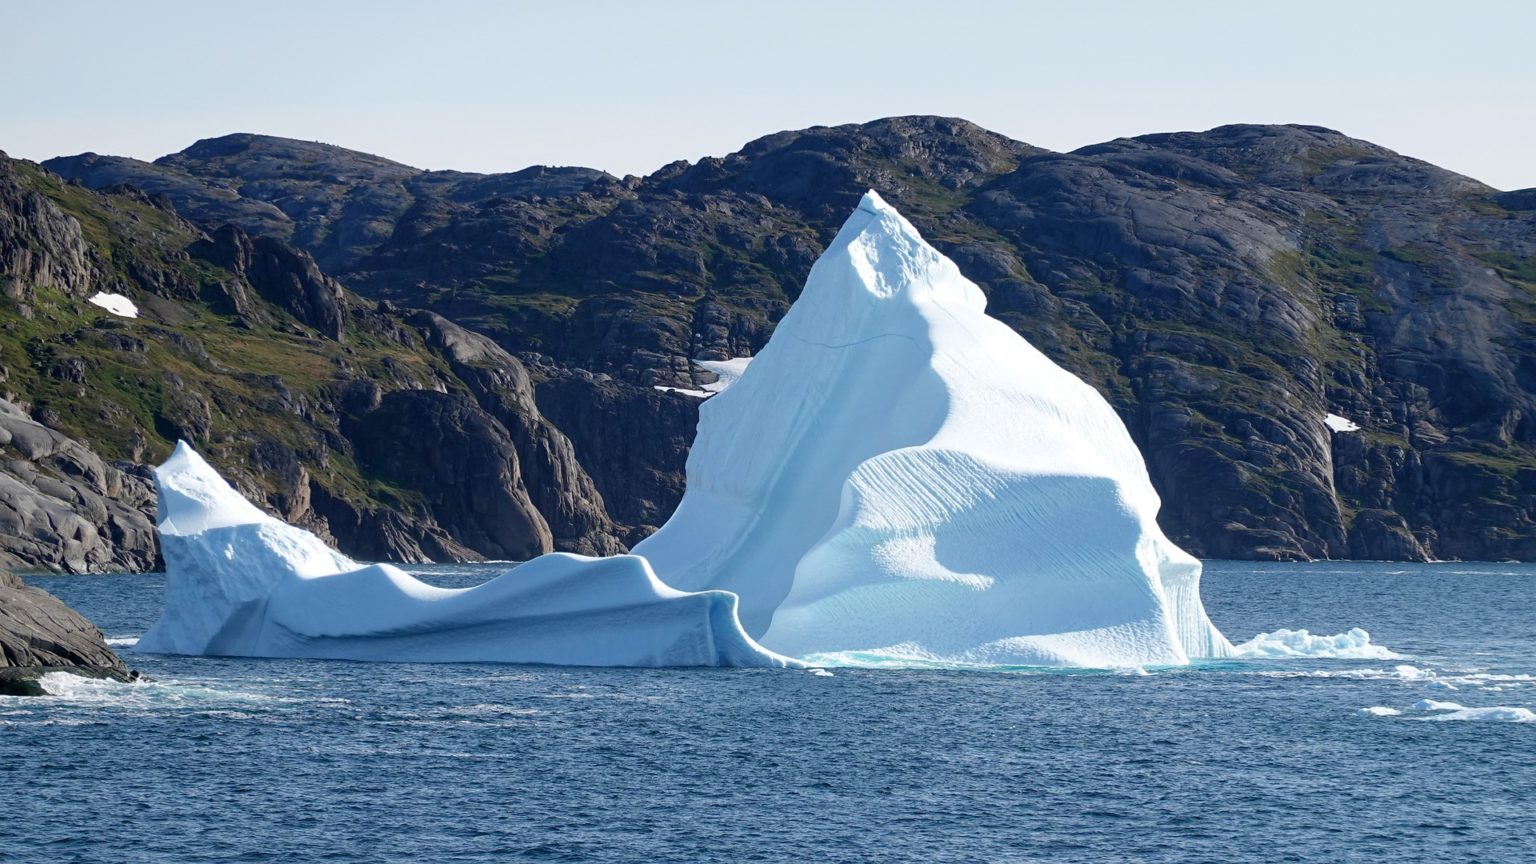
    Satellite data show how on 4 August 2026 a roughly 76 square-kilometre section of the floating ice tongue of the Petermann Glacier in northwest Greenland broke off. The event was visible in radar images from the European Copernicus satellite Sentinel-1. It is the largest loss of floating ice at this glacier since 2012 and is considered one of the most significant calvings in the Arctic since 2020.

    Background

    The Petermann Glacier terminates in a long ice tongue that is partly afloat on the sea. Such floating tongues form when ice flowing from the interior reaches the fjord and rests on the water. Large calvings are abrupt, but they result from longer-term processes such as thinning caused by warmer seawater, the progression of fractures, and structural weakening from surface melt.

    Drivers and processes

    Calvings occur when existing cracks and weak zones mechanically fail. The risk increases when the ice tongue thins or when warmer water enters the fjord and attacks its underside. The Arctic has been warming markedly faster than the global average (Arctic amplification) for decades, which alters oceanic conditions and can undermine the stability of these tongues.

    Why this matters

    The loss of floating ice does not directly raise sea level. However, it can reduce the buttressing effect of the ice tongue. If that resistance is lost, the flow of land-based ice toward the coast can accelerate — with long-term consequences for global sea level.

    Regional impacts

    Large calvings release icebergs that can affect shipping routes and local ecosystems. In narrow fjord systems, big ice pieces often change sea-ice conditions and complicate navigation.

    Observing from space

    Sentinel-1 uses radar and provides reliable imagery regardless of light or cloud conditions. This allows calvings to be tracked almost in real time, fractures to be mapped, and ice flow rates to be determined. The data complement in situ measurements and oceanographic observations in the fjord to better understand submarine melting, changes in grounding line position and the response of the inland glacier.

    Greenland's role in sea level

    Greenland has been losing mass for years through enhanced surface melt and faster glacier discharge. Changes are particularly pronounced at the ice-sheet margins where ice meets seawater. Visible calvings like the one at Petermann are part of a longer-term process with global relevance.

    Outlook

    Continuous satellite monitoring remains central for detecting trends, improving models and assessing risks. For coastal communities in Greenland, adapting to changing ice and weather conditions is becoming increasingly important. The better the processes at glacier fronts are understood, the more reliably future contributions from Greenland to sea level can be projected and the more effectively adaptation and mitigation decisions can be supported.
  • Upper Assam 2026: Repeated Flooding — Greatest Damage from Exposure and Structural Weaknesses, Climate Signal Unclear

    Upper Assam 2026: Repeated Flooding — Greatest Damage from Exposure and Structural Weaknesses, Climate Signal Unclear

    Repeated extreme rainfall between late June and early August 2026 triggered flash floods and prolonged inundation in Upper Assam and the adjacent hills of Nagaland and Arunachal Pradesh. The districts of Sivasagar, Charaideo and Jorhat were particularly affected. Short, very intense downpours first caused flash floods in tributary valleys, followed by extensive flooding across the plains. Settlements, infrastructure and agricultural land suffered heavy damage.

    Main drivers of the damage

    The heaviest losses were primarily caused by high exposure and structural vulnerability. Exposure refers to the concentration of people, buildings and crops in flood-prone areas. Structural vulnerability denotes their susceptibility to flooding — for example due to low-quality construction, lack of safe shelters, inadequate drainage and fragile protective structures.

    Amplifying factors

    – Settlements and agricultural areas are often located in natural floodplains that are meant to absorb water during high flows. – In the hilly areas, deforestation and erosion promote faster runoff; sedimentation silts up river channels and reduces their discharge capacity. – Poor maintenance and local failures of embankments and levees in some places caused sudden and especially destructive flood waves.

    Climate signal remains uncertain

    An analysis of the available observational records did not reveal a clear signal of increasing extreme precipitation for the region. Climate models and statistical analyses produced partly contradictory results. Natural variability, limited data records and the complex topography complicate conclusive attribution.

    At the same time: global warming increases the atmosphere's moisture-holding capacity, which can favor more intense rainfall. How this plays out locally depends on meteorological patterns, monsoon variability and geography. In Upper Assam, the specific weather situations of summer 2026, together with landscape changes, contributed to the observed extremes; whether such events will become more frequent over the long term remains open.

    Implications for protection and preparedness

    When exposure and infrastructure shortcomings dominate the damage, local adaptation comes to the fore. In the short term this means early warning and orderly evacuation: reliable alert systems, clearly marked safe areas, regular drills and communication that reaches remote and marginalized communities.

    In the medium and long term, integrated catchment management is needed. Key elements:

    – Restoration of river floodplains and wetlands to strengthen natural water storage. – Reforestation and soil conservation in hill regions to reduce surface runoff and erosion. – Review and targeted redesign of embankments and levees to avoid false security and reduce breach risks. – Spatial planning that directs settlement growth away from high-risk zones and promotes alternative livelihoods.

    Coordinated action between states and at local levels is also required. River-basin management must consider source regions and plains together. Sharing data on rainfall, river gauges and land-use change improves forecasts and local decision-making.

    Outlook

    The recent floods underline that severe damage can occur even without a clear climate signal when societies are highly exposed and insufficiently prepared. Adaptation measures can be implemented despite uncertainties and increase resilience across different futures. Longer observational records and higher-resolution models would help to better separate natural variability from human influence in the future. For affected communities, the priority now is practical action: review protective infrastructure, restore natural retention areas, secure evacuation routes and strengthen risk awareness.

  • European seas hit record heat in July – ecosystems and coasts under pressure

    European seas hit record heat in July – ecosystems and coasts under pressure

    Record highs in July

    Sea surface temperatures in July 2026 along Europe’s Atlantic coast and in the western Mediterranean were well above long-term averages. Local anomalies of up to 6 °C were recorded. The heat extended over large areas and led to widespread marine heat events.

    Causes of the extremes

    Oceans absorb roughly 90 percent of the excess heat caused by greenhouse gases. This alters currents, oxygen levels and chemical conditions. Persistent high-pressure systems with intense sunshine and weak mixing amplify the effect. Attribution analyses show that global warming makes such events significantly more likely and more intense.

    Ecological consequences at sea

    Many marine organisms have narrow temperature tolerances. When these limits are exceeded, stress, disease and mass mortality occur. Seagrass beds, such as Posidonia, decline or bleach. Kelp forests shrink, and corals and gorgonian communities show increased bleaching and mortality.

    Warmer water holds less dissolved oxygen, favoring hypoxia zones: mobile species move away while sessile organisms suffocate. Higher temperatures also promote harmful algal blooms and parasites. Food webs are thrown off balance; many species migrate to cooler regions.

    Species shifts and invasive species

    Warm-water, sometimes invasive species are moving into new areas and altering existing ecosystems. Native species face increased competition, and fisheries see changes in stock composition and fishing grounds.

    Impacts on economy and society

    Fisheries and aquaculture report stock declines, quality losses and altered catch patterns, with economic losses as a result. Mussel and oyster farms suffer harvest failures, also due to more frequent algal blooms. Coastal tourist regions must contend with longer periods of very warm water and associated health risks. Biodiversity loss also reduces the role of coastal ecosystems as carbon sinks, for example through the decline of seagrass meadows.

    Local adaptation

    Building resilience in protected areas, restoring habitats—such as replanting seagrass—and protecting nursery areas strengthen resistance. Reducing local pressures like nutrient inputs, pollutants and overfishing gives ecosystems space to recover.

    Early warning systems for marine heatwaves support proactive management, for example with time-limited fishing restrictions or protection measures for particularly vulnerable stocks. Coastal municipalities are relying on flexible fisheries rules, economic diversification and close monitoring and research. In aquaculture, site- and species-specific adaptations are being considered, such as more robust cultured species.

    Climate policy as leverage

    Without a substantial reduction of greenhouse gas emissions, protection and adaptation measures will lose effectiveness. Energy efficiency, expansion of renewables and cutting emissions reduce the frequency and intensity of marine heatwaves—and thus help protect the oceans as a critical buffer and carbon reservoir.

    Why the issue will persist

    The recent records point to a new normal: marine extremes are occurring more often and more intensely. This affects food security, economic stability and social cohesion in coastal regions. Consistent action can reduce future damage and preserve the functions of the seas on which millions of people depend.

  • ISS Shows Smoke over Mount Hood and Mount Rainier: Fires Shape Summer 2026 in the Pacific Northwest

    ISS Shows Smoke over Mount Hood and Mount Rainier: Fires Shape Summer 2026 in the Pacific Northwest

    Astronauts aboard the International Space Station captured striking images in the summer of 2026: a thick layer of smoke hangs over the snow‑capped peaks of Mount Hood and Mount Rainier. The orbital perspective makes the wide extent of fires in the Pacific Northwest visible and shows how smoke and particles are transported high into the atmosphere.

    Air quality and health

    The photos document not fog but fine particulate layers originating from multiple fires. Near the surface, the smoke sharply degrades air quality; fine particles (PM2.5) penetrate deep into the lungs and raise risks for cardiovascular and respiratory illnesses. Older people, children and those with preexisting conditions are especially vulnerable. Reduced visibility also affects tourism and creates strains for agriculture.

    Aerosols aloft

    Intense fires generate smoke plumes that updrafts carry into the free troposphere. There, soot and organic particles can remain airborne longer and travel long distances. Light‑colored particles reflect sunlight, while dark particles like soot absorb it—effects that can alter the regional radiation balance, cloud formation and precipitation patterns.

    Impacts on snow and ice

    When dark particles settle on snow and ice, albedo drops: the surface reflects less sunlight and absorbs more energy. That accelerates melting. On mountains such as Mount Hood and Mount Rainier, this changes the timing and magnitude of seasonal runoff into downstream river systems.

    Weather in 2026 and the climate trend

    The summer of 2026 was unusually hot and dry in parts of the U.S. Northwest. Extended heat spells, early snowmelt and low soil moisture increased fire susceptibility. Climate change amplifies these risks by increasing heat, extending dry periods and shifting vegetation cycles. Warmer winters can also favor pest outbreaks that weaken forests and create additional fuel.

    Acute and long‑term effects

    In the short term, smoke events cause poor air quality, health advisories, reduced visibility and local evacuations. Over the long term, repeated large fires alter soils, vegetation patterns and watershed stability. Emissions of carbon dioxide, soot and other gases affect atmospheric composition and—depending on scale and frequency—can influence the greenhouse gas balance.

    Observation from space and on the ground

    The ISS photos complement satellite measurements that track plume spread, particle concentrations and temperature fields. Combined with ground observations, they help form a situational picture that supports warnings, protection of vulnerable populations and planning for possible evacuations.

    Society and ecosystems

    The impacts of the fires extend beyond forests. Changes in snow and ice dynamics affect drinking water supplies, agriculture and infrastructure such as reservoirs. While fire is a natural element in some ecosystems, increasing intensity and frequency make adaptation more difficult. Potential consequences include species losses, enhanced erosion and the conversion of forests to grasslands.

    Interpreting the images

    The ISS images link visible landscape changes to health, hydrological and climatic processes. They demonstrate how local fires can produce regional—and in some cases wider—effects, underscoring the value of international observation capabilities.

    Outlook

    With fires becoming more frequent and intense, preparedness, health protection and adaptation gain importance. Precise monitoring, adapted forest and water management, and support for especially vulnerable groups are key components of responding to a changing risk landscape.

  • July 2026: Hottest July Ties with 2024 — What the Record Means

    July 2026: Hottest July Ties with 2024 — What the Record Means

    July 2026 equalled the global heat record for that month. The global mean surface temperature was 1.18 °C above the 20th-century average — identical to July 2024. Such monthly values are not isolated events but part of a longer-term warming trend.

    Why the record matters

    The global monthly figure is based on measurements over land and oceans. When it sits well above the long-term average, it indicates widespread warming — not just local heat events. That increases the likelihood of heatwaves, droughts and intense rainfall, with consequences for health, infrastructure and nature.

    Trend and context

    Since systematic records began, high-end values have become more frequent because greenhouse-gas-driven warming is overlaying natural variability. That July 2026 matches the 2024 record fits into this pattern of a new, warmer baseline.

    Regional differences and impacts

    The global number conceals regional contrasts: some areas experience extreme heat, others increased precipitation. This affects harvests and water availability and raises stresses in cities, particularly for vulnerable groups such as the elderly and socially disadvantaged.

    Oceans under heat stress

    The oceans absorb much of the excess heat. Above-average sea surface temperatures favor marine heatwaves, coral bleaching and shifts in fish stocks — with economic risks for coastal communities, fisheries and tourism.

    Precipitation: a more intense hydrological cycle

    Warmer air holds more moisture. That intensifies heavy rainfall events while other regions become drier. Flood and drought risks therefore grow simultaneously. Global averages can obscure the decisive regional patterns.

    Implications for policy and the economy

    Adaptation becomes more urgent: heat-protection plans, early-warning systems, heat-resilient urban design, climate-adapted agriculture and coastal protection reduce risks. At the same time, mitigation of greenhouse-gas emissions remains central to lowering the chance of further record months in the long term.

    Attribution and uncertainties

    A single monthly record cannot be fully attributed to individual causes. Climate science separates short-term natural fluctuations from the long-term trend. Statistical analyses, however, show that human-caused warming significantly increases the probability of such large departures from the norm.

    Outlook

    Parallel steps are needed: immediate measures to protect against heat and extreme precipitation, and long-term emissions reductions. Continuous monitoring and transparent reporting provide the basis for effective decisions.

  • NOAA Hollings Scholarship for UW–Madison Student: Wildlife Ecology at the Intersection of Sea and Climate

    NOAA Hollings Scholarship for UW–Madison Student: Wildlife Ecology at the Intersection of Sea and Climate

    Award with a practical focus

    Courtney Urbanek, a wildlife ecology student at the University of Wisconsin–Madison, has been selected for the NOAA Hollings Scholarship 2026. The award pairs financial support with a mentored research internship at the U.S. National Oceanic and Atmospheric Administration (NOAA), giving early-career researchers access to data, methods and professional networks.

    Relevance of wildlife ecology in a changing climate

    Wildlife ecology examines species distributions, habitats and interactions—factors that shift as temperatures, precipitation patterns and coastal dynamics change. The discipline provides decision-relevant evidence for the management of protected areas, fisheries and urban biodiversity, linking local observations to broader trends.

    From fieldwork to application

    The Hollings program emphasizes applied research. Scholars complete a paid internship at NOAA under professional supervision. In practice, field methods are integrated with large-scale datasets to identify indicators of ecological change and derive management recommendations—whether for monitoring, conservation measures or local adaptation strategies.

    Networks and visibility

    Participation raises visibility within federal agencies and opens career pathways in government, consulting, NGOs and academia. Broad experience profiles and perspectives improve the uptake of research findings in policy and society.

    From local knowledge to regional planning

    Habitat mapping and movement surveys provide building blocks for regional analyses. Changes in river systems and coastal ecosystems affect food webs for migratory birds and fish—with consequences for fisheries and protected areas. Insights from NOAA internships feed into long-term monitoring programs and refine spatial models for robust forecasts, for example when designating buffer zones or planning rescue operations.

    Skills for a diverse job market

    The program teaches field skills, data analysis, science communication and an understanding of policy processes. This combination reflects the reality of contemporary climate and marine research, where ecology, climate science and social sciences collaborate.

    Significance for climate action

    Effective climate action requires local data collection, reliable documentation of change and actionable solutions. Supporting early-career researchers in wildlife ecology ensures that expertise about local ecosystems informs decision-making and that measures gain acceptance more quickly.

    Outlook

    For Urbanek, the Hollings Scholarship links rigorous training with immediate practice at NOAA. Working at the interface of wildlife ecology, marine issues and climate adaptation strengthens knowledge transfer and delivers benefits for communities, agencies and research.

  • Satellites show: Europe’s forests have lost significantly more biomass since 2018

    Satellites show: Europe’s forests have lost significantly more biomass since 2018

    Since 2018 Europe’s forests have experienced considerably stronger biomass losses than previously assumed. Current analyses of Earth observation data point to this trend. Affected areas include not only weakened or young stands but also old, previously stable forests. The decline in woody biomass — in trunks, branches and roots — reduces forests’ CO2 uptake capacity and can release stored carbon back into the atmosphere.

    What the data show

    Spatially consistent analyses indicate a new pattern of large-scale losses since 2018 that cannot be explained solely by regular management. In several regions, damage has become more frequent and extensive, visible as reduced stand densities and sparser crowns.

    How remote sensing measures it

    Modern satellites combine radar, lidar and multispectral measurements. From these signals, woody biomass can be estimated across large areas and compared over years. Long-term, wall-to-wall observation makes it possible to rapidly identify trends and hotspots — independently of local inventory cycles.

    Drivers: drought and pests

    Prolonged dry periods weaken trees’ defenses. Insect pests such as bark beetles simultaneously benefit from warm, dry winters and longer growing seasons. Disturbances often overlap: drought facilitates infestations, the resulting canopy gaps dry out further and become more susceptible to erosion and structural shifts. Such cascades produce nonlinear damage — the combined effect of multiple stressors exceeds each one individually.

    Why old forests suffer particularly

    Older stands store large amounts of woody biomass but react sensitively to sudden water shortages. Historically shaped, even‑aged structures increase vulnerability when extensive areas reach advanced age at the same time. Conditions are aggravated on sites with shallow soils or at mountain margins, where persistent drought depletes soil moisture. Pure non‑intervention does not reliably protect everywhere under changed climatic conditions.

    Consequences for climate, economy and biodiversity

    As biomass declines, net carbon uptake falls. Locally, forests can temporarily become carbon sources when dying wood decomposes. For the timber sector this means lower predictable harvest volumes alongside more damaged timber — a combination that strains quality, logistics and profitability. Ecologically, structure, light regimes and species composition change: some species may benefit in the short term from increased deadwood, others lose habitat; in the long term, there is a risk of losing stable, species‑rich forest communities.

    What to do now

    Satellite‑based monitoring serves as an early warning system and should be linked with targeted field inventories. Adaptation strategies include structurally diverse mixed stands, regeneration with heat‑ and drought‑tolerant species and soil management measures to improve water retention. Where damage is severe, interventions are warranted: site‑adapted reforestation, selective removal of diseased trees and effective, ecologically sound protection against pest insects. At the same time, the sector needs flexible supply chains and methods to use damaged timber while limiting ecological risks.

    Adjusting policy

    Continuous Earth observation combined with local inventories provides the data base needed to set priorities: which stands are chronically affected, where are short‑term measures required? Support instruments for climate‑resilient management, stand diversification and assistance for adaptation measures gain importance. Europe’s forests remain central actors in climate protection — their role as carbon stores must, however, be actively secured.

  • Danube near Budapest falls to very low levels – satellite images reveal scope of the drought

    Danube near Budapest falls to very low levels – satellite images reveal scope of the drought

    Satellites document sharply reduced water levels

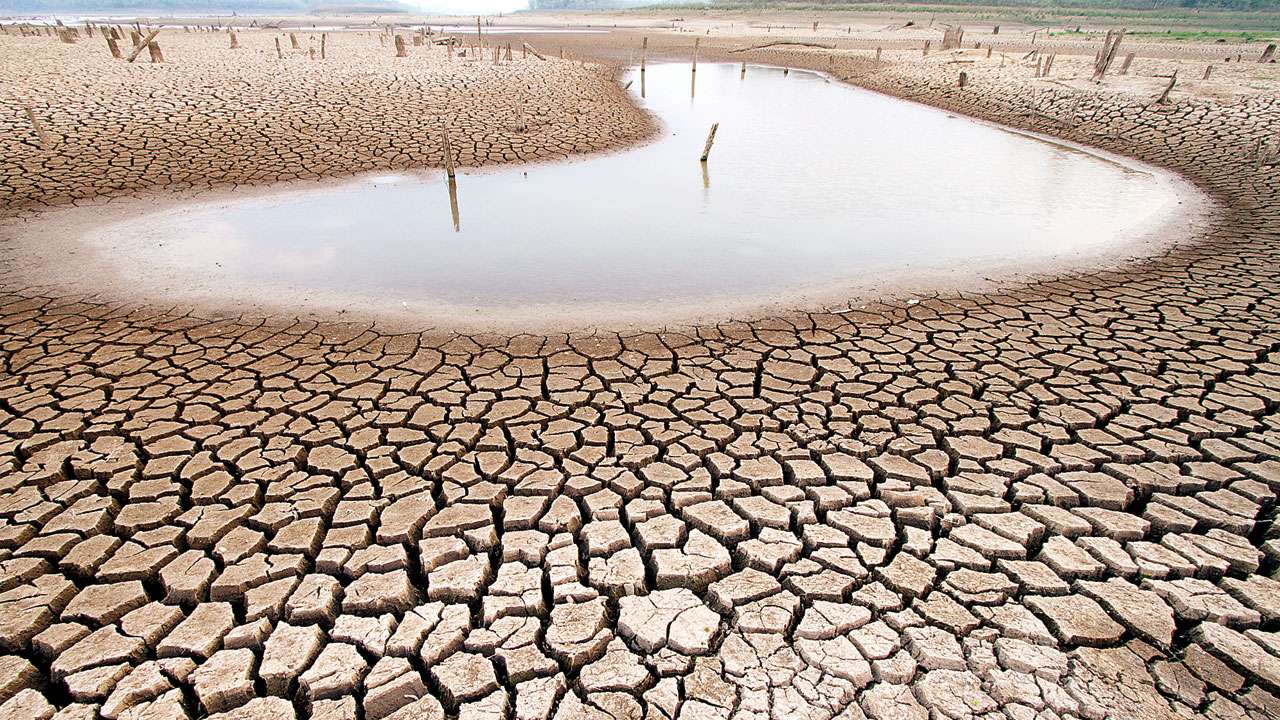
    New Sentinel-2 images from the European Copernicus programme show the Danube north of Budapest markedly narrowed and, in places, segmented. Exposed sandbanks, shifted shorelines and dried-up side branches are clearly visible. In some sections very low gauges — even record levels — have been reported.

    Bottlenecks for shipping

    The visible changes in the riverbed narrow navigation channels and shift shallows. Sand deposits and erosion change rapidly; buoys and beacons lose reliability. The consequences are reduced loading drafts, cuts in capacity, rising transport costs and temporary closures of individual stretches along the Danube corridor.

    Impacts on energy and the economy

    Low water reduces discharge volumes and thus the output of hydropower plants. Companies that rely on inland shipping for bulk goods come under cost pressure because transports have to be rescheduled or shifted to other modes of transport.

    Ecological pressures increase

    Lower flows favour higher water temperatures and declining oxygen levels, especially on hot days. Nutrient concentrations can rise locally, increasing the risk of fish kills and cyanobacterial blooms. Riparian zones temporarily lose their function as spawning and resting habitats. Altered flow paths also change sediment dynamics and therefore habitats.

    Climatic context

    The development fits into a broader trend: heat waves and longer dry spells are occurring more frequently in Europe. Rising temperatures increase evaporation, vegetation draws more water from the soil, and altered weather patterns reduce regional precipitation. Taken together, this leads to lower groundwater recharge and reduced summer inflows.

    The role of remote sensing

    Sentinel-2 provides high-resolution, regularly repeated images. They complement gauge and hydrometric measurements by making spatial changes in river extent, exposed sediments and bank dynamics visible. Authorities and operators use such data to plan navigation restrictions, examine diversion options and prioritise environmental monitoring.

    Short- and long-term measures

    In the short term, those responsible respond with traffic restrictions, reduced loading limits and increased navigation monitoring. River management relies on controlled releases from reservoirs, coordinated use of storage and agreements between riparian states to secure minimum flows.

    Long-term integrated strategies are required: denser monitoring networks, restoration of floodplain areas, water-saving practices in agriculture and industry, and expansion of storage and buffering capacities. Crucially, ecological minimum flows must be ensured to avoid damage to river habitats.

    Assessment of the findings

    The images north of Budapest make the reach of the drought visible — from navigation and energy supply to ecosystems. They underline the need for forward-looking planning and cross-border cooperation to better cope with recurring low-water phases.

  • NOAA confirms: Atlantic hurricane season 2026 expected to be below average

    NOAA confirms: Atlantic hurricane season 2026 expected to be below average

    NOAA stands by its forecast

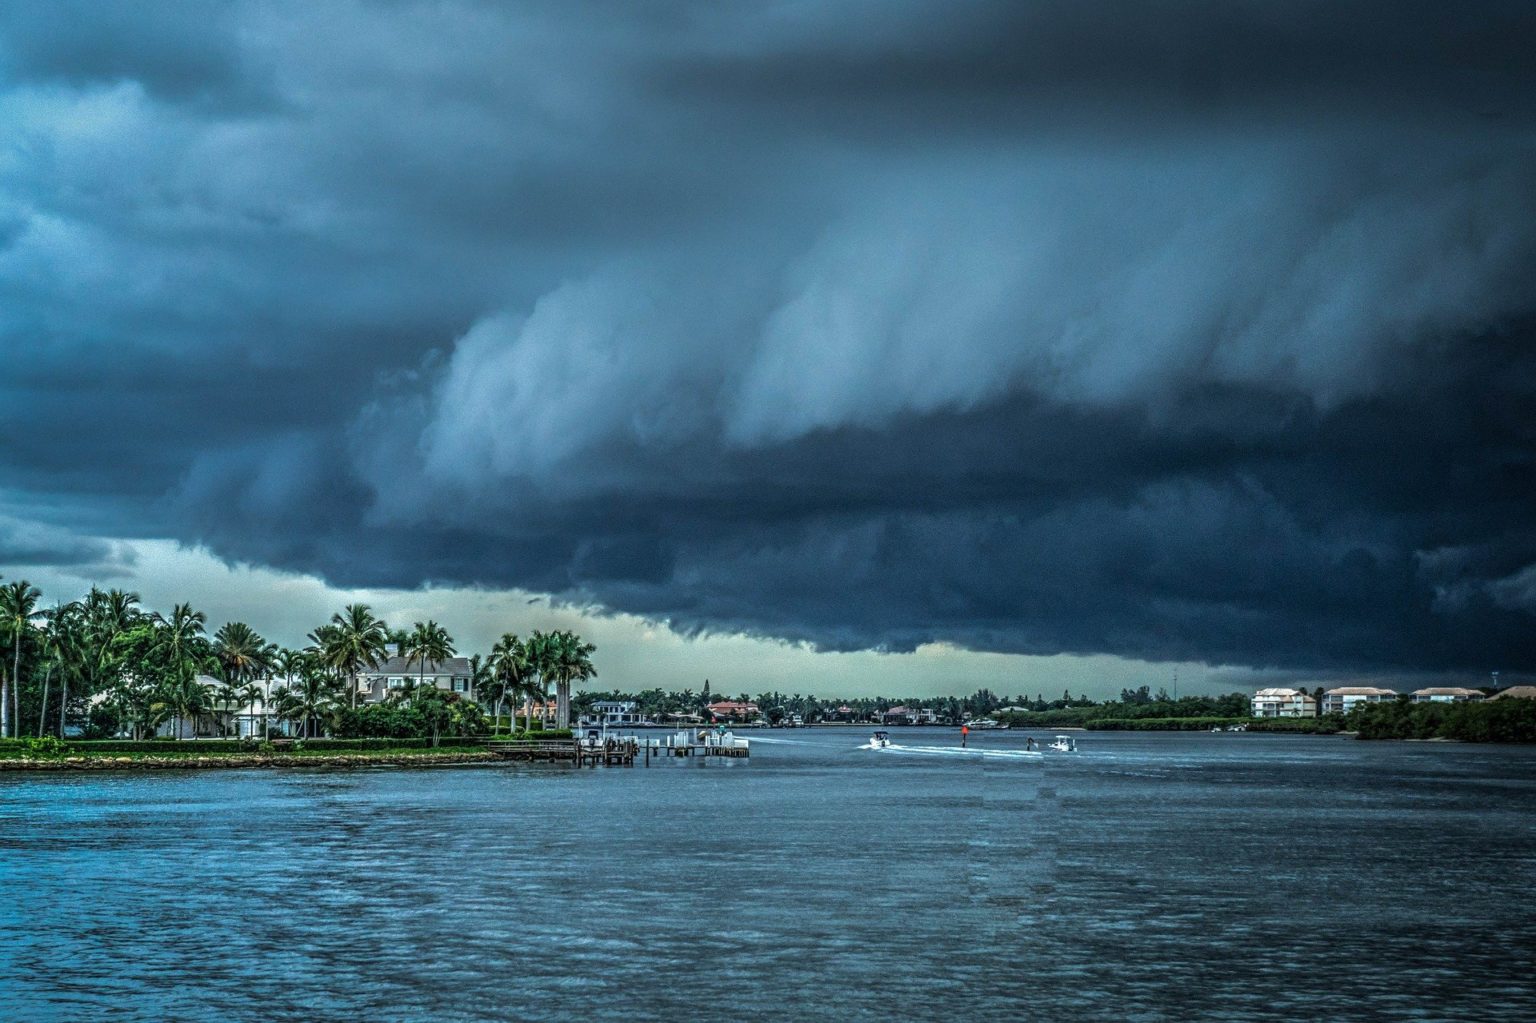
    For the Atlantic season from 1 June to 30 November 2026, NOAA expects 7 to 13 named storms (winds ≥ 63 km/h), of which 2 to 6 will become hurricanes (winds ≥ 119 km/h) and 0 to 2 will be major hurricanes (winds ≥ 179 km/h). The agency assigns a 75 percent probability to a below‑average season, 20 percent to an average season and 5 percent to an above‑average season. The ranges include systems that have already been observed.

    Putting the numbers in context

    The reference period 1991–2020 has an average of 14 named storms, 7 hurricanes and 3 major hurricanes. NOAA’s outlook falls below those climatological averages. Seasonal outlooks assess overall basin activity — they are not forecasts of individual storm tracks or landfalls. Even with fewer total storms, single systems can still cause substantial damage.

    Seasonal timing

    Peak activity typically occurs in late summer, around early to mid‑September. During this period, the formation and intensification of tropical systems usually increase.

    Basis of the assessment

    NOAA combines observations and model projections. Influencing factors include sea surface temperatures, large‑scale circulation patterns, vertical wind shear, moisture over the tropical Atlantic and Saharan dust transport. Low wind shear and warm surface waters favor development; strong shear and dry air suppress it. The assessment will be updated during the season as new data become available.

    Preparedness remains essential

    A below‑average season is not an all‑clear. Coasts, islands and low‑lying areas remain at risk from storm surge, heavy rainfall and strong winds. Practical steps include: – Reviewing evacuation and communication plans – Assembling emergency supplies (water, food, medications) – Securing buildings and loose outdoor items – Keeping important documents and insurance information accessible and organized

    Follow operational warnings

    The seasonal outlook does not replace short‑term hazard information. Satellites, reconnaissance flights and weather models continually provide forecasts of storm tracks and intensity. Residents and authorities should monitor official warnings and act promptly on instructions.

    Climate background

    Long‑term warming can increase the intensity and rainfall of individual tropical cyclones. At the same time, changes in frequency and regional distribution remain uncertain. Seasonal forecasts account for these signals but provide probability ranges rather than precise predictions.

    Outlook

    NOAA’s forecast points to overall reduced activity but does not lessen the need for vigilance and preparation. Ultimately, the danger from the season will depend on the tracks and timing of individual storms.

  • From Battleground to Protected Site: The Underwater Legacy of the USS Monitor

    From Battleground to Protected Site: The Underwater Legacy of the USS Monitor

    A pioneer of naval history

    The USS Monitor marks a technological turning point in shipbuilding. As an early ironclad, it changed construction and tactics in naval warfare. Its wreck recalls war, innovation and the people who served aboard.

    From warship to protected asset

    What was once a platform of combat has become a protected place of maritime remembrance. Marine conservation and cultural heritage programs place the site under protection, document it scientifically and make its history publicly accessible. At the center is the question of how historic fabric can be reconciled with natural processes.

    An artificial reef with side effects

    Wrecks often develop into complex habitats. The Monitor’s metal structures form an artificial reef where mussels, crustaceans, sea anemones and fish take hold. This colonization alters local food webs and provides refuges in otherwise structure-poor surroundings. At the same time, the wreck remains worthy of protection as cultural heritage: growth must not impede the documentation and preservation of historic surfaces.

    Climate pressure and marine dynamics

    Sea level rise, warmer water and more intense storms are changing conditions at the site. Chemical shifts accelerate corrosion, while currents and storm events can move sediments, displace debris and expose vulnerable areas. Warmer water also promotes biological growth that creates habitat but can attack surfaces. This creates a dual challenge: securing historical traces while taking newly formed habitats into account.

    Research and conservation

    Study of the wreck relies on modern methods. Remotely operated underwater vehicles, high-resolution sonar systems and digital photogrammetry enable precise mapping without constant physical intervention. These produce datasets for archaeological documentation, biological colonization and for understanding currents and sediment dynamics. Recovered objects are restored and stabilized for the long term, while repeated site surveys reveal erosion patterns and causes of damage and inform protective measures.

    Legal framework and the public

    The wreck’s protection status arises from cultural and nature conservation regulations that cover not only individual artifacts but whole marine areas. These frameworks enable research, regulated low-impact investigation and educational offers. Museums, exhibitions and digital formats make the findings accessible and raise awareness of the vulnerability of maritime heritage.

    Education and participation

    Participatory formats involve the public. Citizen science, educational programs and interactive media convey the wreck’s significance and demonstrate that decisions about protection, use and research are negotiated socially.

    Outlook: balancing protection and change

    The USS Monitor embodies the tension between historical legacy and a dynamic marine system. As climate-driven changes progress, flexible strategies are needed that combine technical monitoring, natural science research and public participation. This approach can preserve cultural memory while safeguarding the site’s ecological functions.