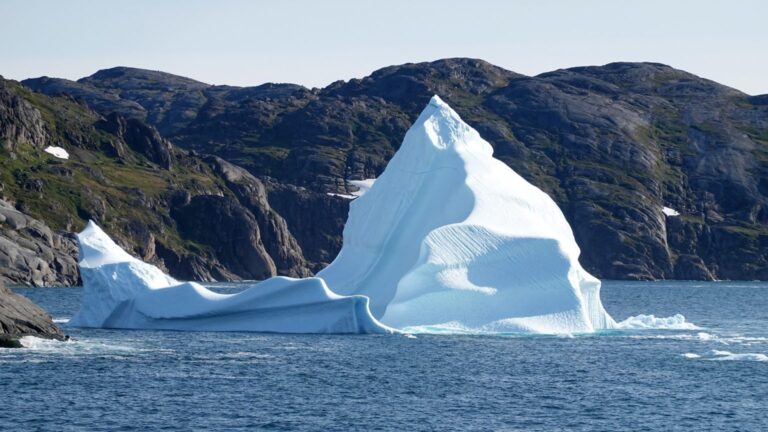
The European Space Agency (ESA) published a new image series for the week of 29 June to 3 July 2026. The motifs show landscapes, coastlines and cloud fields — and at the same time provide measurable indications of climate dynamics and environmental change. The selection ranges from large-scale patterns in vegetation, water and sea ice to fine structures within cities.
Sensors and time series
Different sensors complement one another: optical data capture colour and texture, infrared measurements highlight temperature differences, and radar penetrates clouds to record terrain features and ice surfaces. Combining these datasets produces time series that reliably document trends such as glacier retreat, vegetation change or seasonal shifts.
Crisis monitoring in real time
During extreme events, satellite images create an up-to-date situational picture and support decision-making. Flooded areas can be delineated quickly from space, fire hotspots appear as thermal signatures, and storm damage is revealed by destroyed infrastructure or damaged vegetation. These data complement local reports and reach responders and authorities in a timely manner.
Long-term signals from ice, sea and vegetation
Viewed in series, climatic trends become clear: polar sea ice shows area loss and fragmentation, coastal images document erosion and sediment displacement. Sea surface temperatures, algal blooms and upwelling zones provide clues to ecosystem dynamics and impacts on fisheries. On land, vegetation indices such as NDVI indicate vitality and stress; optical and radar data together improve assessments of crop risk and strengthen early-warning systems in agriculture.
Urban areas
In cities, satellite images reveal urban heat islands influenced by roofs, road surfaces and sealed ground. Such maps help municipalities with greening programs, adapted land-use planning and the designation of cooler zones. Night-time imagery can show light emissions and light pollution, complementing analyses of usage patterns.
Atmosphere in view
Satellites also detect atmospheric processes. Dust, smoke and industrial emissions appear as extensive plumes. These observations feed into air quality forecasts, support the monitoring of limit values and improve understanding of how aerosols affect the radiation balance and cloud formation. Together with ground-based measurement networks, they create a more complete picture of the atmosphere.
Societal relevance and context
Striking satellite images increase awareness of the consequences of climate change and make the distant impacts of human activity visible — from melting glaciers to widespread smoke plumes. At the same time, interpretation requires context: a bright spot is not automatically a fire, and a colour change is not necessarily vegetation loss. Expertise and complementary data remain indispensable.
Tools for policy and practice
The ESA Images of the Week present satellite imagery as a working basis for research, planning and rapid response. Governments use them for climate models and adaptation strategies, municipalities for local protective measures, and research teams for long-term studies. Behind every image is a dataset that helps ground decisions in a changing world.
ESA Top News
The original source allows readers to verify the source material and subsequent updates.
Open source →