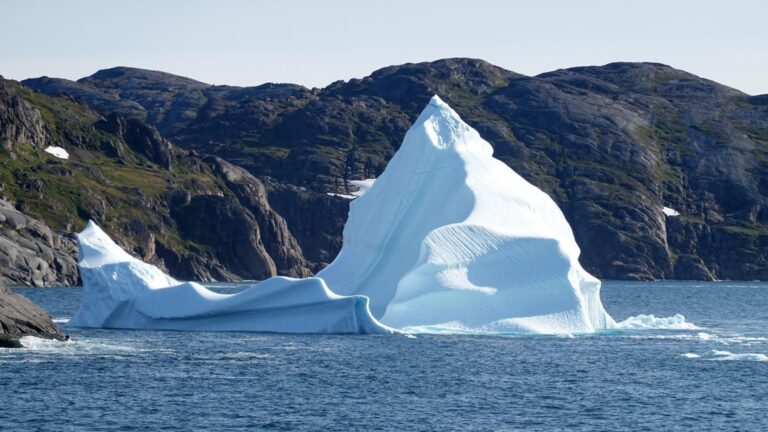
For the week of 27–31 July, the European Space Agency (ESA) is presenting a selection of satellite and astronaut photographs. The images show coastlines, cloud formations, ice sheets, sea areas and urban structures. They provide context for processes that unfold over large spatial scales or beyond the immediate field of view.
How the data are used
Satellite images form the working basis for science, administrations and emergency services. Repeated observations make it possible to trace changes over time: vegetation cycles, glacier and ice‐sheet losses, sea surface temperatures, land‑use change and urban expansion. Authorities use this information for infrastructure and disaster‑risk planning; researchers test models and quantify trends with it.
The technology behind the images
Optical sensors for visible light, infrared and multispectral cameras for vegetation condition and surface temperatures, and radar instruments that deliver data regardless of cloud cover or daylight are employed. The Copernicus satellite fleet enables frequent, repeated monitoring of many regions. Complementary photographs taken from the International Space Station add detail within a broader spatial context.
Monitoring climate‑relevant developments
Satellite data make changes in glaciers and ice sheets, more frequent heat days or shifting vegetation patterns measurable. Such time series support assessments of sea‑level rise, water budgets and ecosystem dynamics. Short‑term hazards such as floods, droughts or smoke from wildfires can be detected quickly — an advantage for prioritization and operational planning.
Practical examples
– Disaster management: rapid situational overviews, mapping of affected areas, identification of access routes. – Agriculture: multispectral data reveal drought stress or nutrient deficiencies and support precision irrigation. – Coastal and marine research: sea surface temperatures and turbidity levels aid monitoring of algal blooms and fisheries areas. – Urban development: time series reveal surface sealing and support more sustainable planning.
Limitations and requirements
Interpretation requires experience: clouds can obscure terrain, seasonal fluctuations must be separated from long‑term trends, and spatial resolution determines the level of detail. Meaningful analyses also depend on data access, computing capacity and high‑quality reference data — as well as tailored presentation for authorities, municipalities and the public.
Why continuity matters
Single events make headlines, but robust decisions rely on consistent time series. Continuous, networked Earth observation provides the basis for early detection of trends and adaptation of measures. The ESA's weekly image selection offers illustrative snapshots and eases access to a central public infrastructure: data on the state of the planet.
ESA Top News
The original source allows readers to verify the source material and subsequent updates.
Open source →